Volunteering with ‘Data 4 Nature’ – Wandering the Woodlands

By now, I’m sure you’ll know that I’ve been trekking around Sheffield’s nature reserves, collecting data for the National Lottery Heritage funded ‘Data 4 Nature’ project. The third and final set of surveys I carried out with ‘Data 4 Nature’ involved monitoring the condition of Sheffield’s woodland reserves. The Sheffield and Rotherham Wildlife Trust take care of some of the most beautiful woodlands in the area, including Wyming Brook: my favourite place to go take a breather from the stresses of university life. We are lucky to live in such a green city, and being 10.4% woodland by area, Sheffield is actually the most wooded city in Britain. We all know the benefits woodlands provide for our physical and mental health: they clean the air we breathe, give us space to exercise our bodies and reduce mental fatigue. We’re not the only ones to benefit though; woodlands are home to more wildlife than any other landscape. Take the humble oak tree – it supports birds nesting in its canopy, small mammals burrowing in its root system, bats roosting in its trunk and up to 280 different insect species living amongst its branches. We need to protect woodlands to make sure they continue to give wildlife a home. So, ‘Data 4 Nature’ has created a monitoring protocol to assess the condition of four key woodlands in Sheffield: Blacka Moor, Moss Valley, Fox Hagg, Wyming Brook. If we know the current state of our woodlands, management can be tailored to maximise benefits to wildlife in the future.

How do we define woodland condition?

‘Data 4 Nature’ developed a protocol for defining the condition of a woodland based on national standards. Woodland condition is broken down into two elements: structural attributes of the woodland, and species composition of the trees. When we talk about woodland structure, we are thinking about things like the amount of dead wood, how many glades are present, and how many invasive species there are in the area. Species composition considers which tree species are found in the woodland, as well as their diversity and age.

The woodland condition surveys started right back in autumn 2018. The team decided to do the surveys twice round, once in the winter, and once in the summer. The winter surveys focused on the structural aspects of woodland condition. We had to wait until the summer to look at species composition – it’s incredibly hard to ID tree species with no leaves! Luckily, the ‘Data 4 Nature’ team don’t expect us to be that good at species ID.

Winter condition training took place in all weather conditions! (Photo credit: Julie Riley)

Our method:

Each woodland reserve was divided up into 1-hectare grid cells, measuring 100m2. In teams of three or four, volunteers followed a pre-planned route through the grid cells, taking measurements as we went. These routes didn’t always stick to the footpaths, so we had to scramble up and down the valley edges to stick as closely to our route as possible (I only fell over once, surprisingly). The biggest challenge we faced was not getting lost in the middle of the woods! So, what were we looking for as we orientated our way between brambles and through thickets?

Evidence of browsing –

Browsing by woodland mammals can severely damage woodland biomass. We assessed how much vegetation in each survey plot was damaged by deer and squirrel browsing, to see how much it impacts the ecosystem. The deer population is currently growing at Blacka Moor Reserve – notable by the number of droppings we found across the landscape! – so it is especially important to ensure deer are not stripping away too much of the woodland. We saw a herd of deer tracking though Blacka Moor during our survey. I’ve never seen deer out in the daylight before, so this was a rare and special sighting.

Invasive species –

We identified and estimated the percentage cover of invasive plant species within each grid cell. In the winter, the most common invasive species you will see are rhododendron and cherry laurel. These species are evergreens, thankfully making them easy to identify in the winter months.

Rhododendron can be identified by its dark glossy leaves, elliptical in shape and measuring around 22cm. These leaves grow in a whorl around a hard, light brown stem. The species has attractive pink to purple flowers located in the middle of the terminal whorl of each branch. Rhododendron is believed to have been introduced to the UK from Gibraltar in 1763. By 1893, it was being sold on London markets as a flowering pot plant. Rhododendron is incredibly difficult to eradicate from landscapes; its small seeds disperses rapidly via the wind and it can grow to fill any space available to it, either remaining as a small shrub, or growing to outcompete native vegetation. Mechanical methods of removing it are highly costly. It was estimated that £30 million would be needed to clear the species from the Snowdonia National Park alone.

Cherry laurel is another invasive species which is easily confused with rhododendron. It also has leathery, dark green, oblong leaves, but these are duller and smaller than rhododendron leaves. Cherry laurel also has erect racemes of white flowers that give rise to black cherry-like fruits. The species was planted in the UK in the 17th Century and was often used for hedging and game cover. Its abundant fruit makes it easy to disperse via birds. Cherry laurel casts a dense shade that excludes other species from accessing light resources. This means it can dominate the shrub layer and reduce diversity in the ecosystem.

Estimating how well established these two species are in Sheffield reserves will allow the Trust to develop management strategies that best prevent it from hindering the growth of native vegetation.

Woodland edge –

Transitions zones between one habitat and another are called ecotones. Ecotones are most valuable to wildlife if change is gradual between neighbouring habitats. For example, an edge which transitions from woodland, to shrub, to grassland is better at allowing wildlife to move through it than woodland which abruptly turns to grassland. We looked at whether the woodland edge measured at least 1.5 times the height of the nearest mature trees, to see if there is a wide edge between the woodland and neighbouring habitat in our woodland reserves.

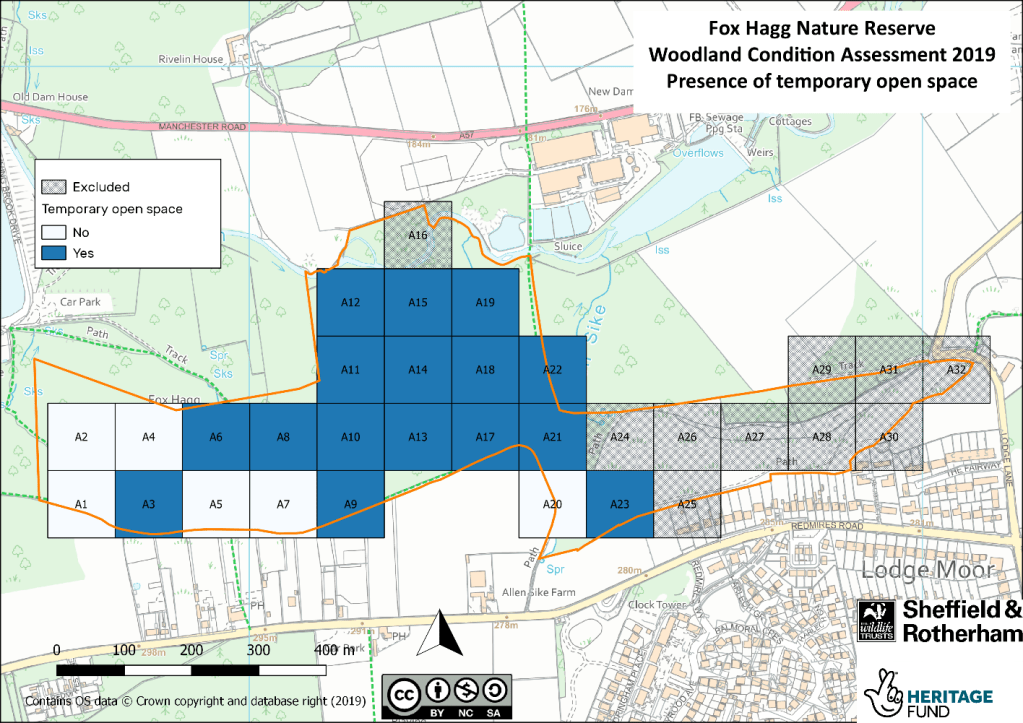
Temporary open space –

The Wildlife Trust need to know how much temporary open space is present in the woodland reserves. These are areas in which trees could regenerate if we stopped cutting back vegetation and allowed natural ecological succession to play out. Areas where trees could regenerate include glades, rides, footpaths and areas of clear-felling. These areas had to be at least 10m in diameter and have less than 20% shrub/tree cover to be counted in our surveys.

Glades and rides are also valuable because they replicate woodland edge habitat inside wooded areas. This creates a ‘heterogenous’ habitat: a habitat with lots of different microhabitats within it. For example, a heterogenous woodland may have some closed canopy areas, open canopy areas, scrubby areas, grassy areas, wetland areas and more. This means a whole host of wildlife adapted to these different microhabitats can be supported. Having ecotones both between habitat types and within woodland is highly valuable because of the range of wildlife they let thrive. Ecotones are more valuable than many other woodland habitats, excluding veteran trees.

Wetland features –

This one was easy – we simply recorded the presence of any pools, ponds, rivers, brooks, streams or bogs in our grid cells. The Trust are aiming to have no net loss of wetland areas in their reserves, as wetland features provide a crucial microhabitat for aquatic wildlife.

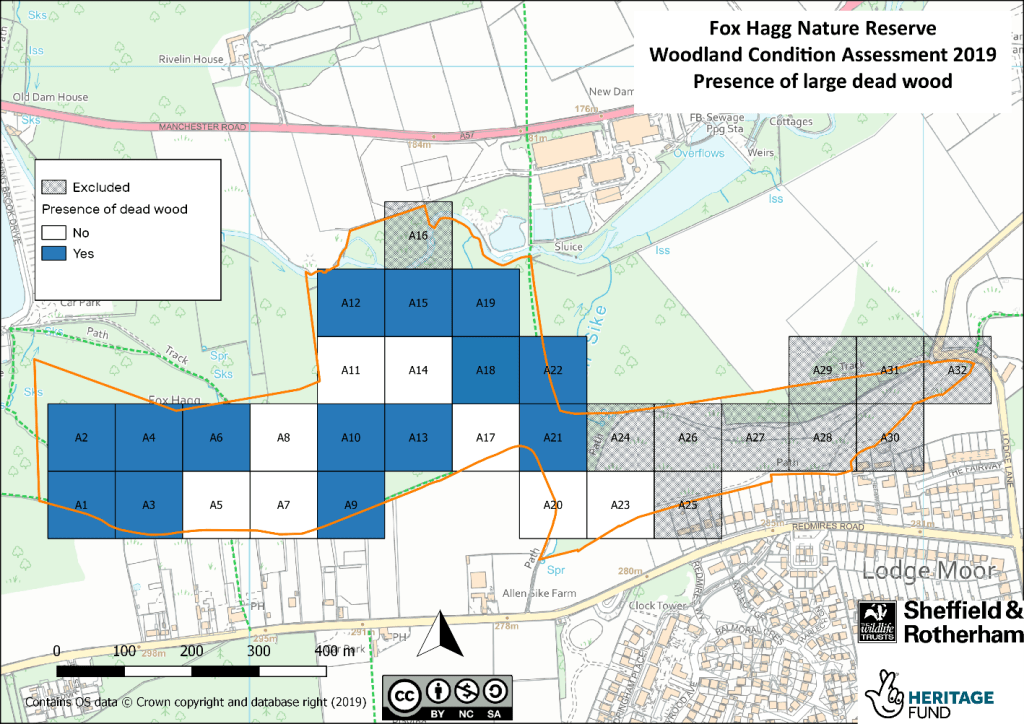
Presence of dead wood –

Identifying how much dead wood was present in each grid cell was important for the Trust to assess how suitable woodland areas are for Willow Tit populations: one of the fastest declining bird species in the UK. Willow Tits require open woodlands with scrubby areas and plenty of dead wood. The Trust have been working to increase the Willow Tit population in Fox Hagg over the past four to five years by providing more suitable habitat.

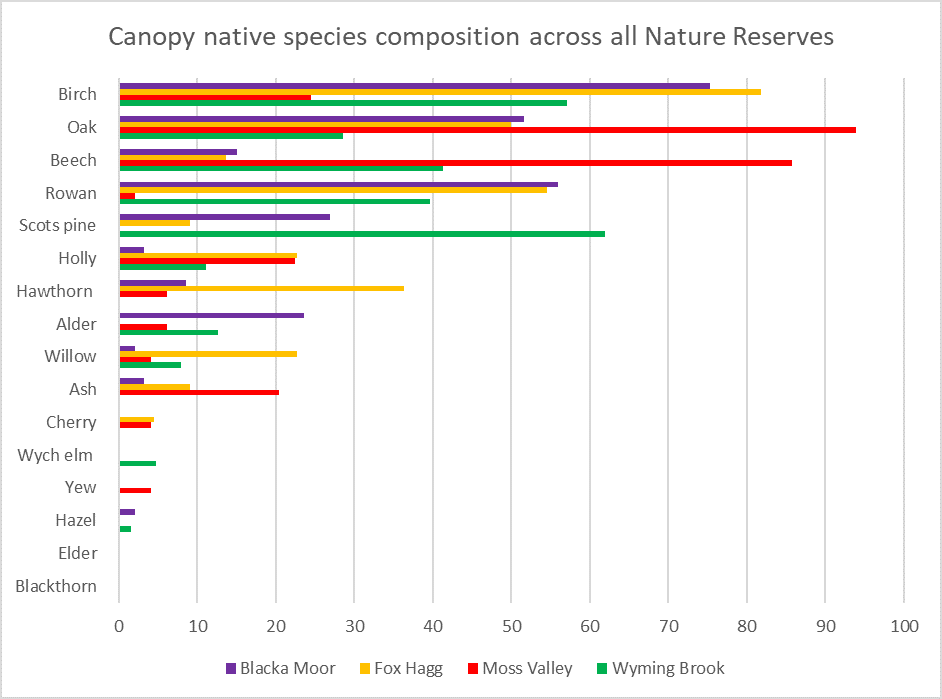
Species composition –

Once the days had started to draw out and the new spring leaves had burst-bud, we could assess the species composition aspect of woodland structure. We used ID sheets provided by the Trust to help us identify and record the presence of tree species in the woodland. There are 16 native and 7 non-native species that are common in the Sheffield area, which we encountered most regularly. We also put the trees into age classes based on the diameter of the tree at breast height. These age classes were: sapling, young, mature and very mature.

Results:

Overall, our surveys showed that the woodland reserves are in good condition. The results indicated that regeneration of native species is ongoing and species diversity was high across all sites. The Trust plan to use this data as a baseline to highlight any future changes in species diversity and composition in the woodland reserves.

Percentage cover of different species making up the canopy cover in each reserve (Figure credit: Patricia Malcolm).

The Fox Hagg surveys showed that there is plenty of dead wood in the woodland to support a viable Willow Tit population. This is great news for the Land Management Team at Fox Hagg, who have been working to clear out glades for the species. However, Fox Hagg represents a difficulty that woodland managers often face: managing to benefit one particular species, versus managing the site as a whole. Normally, woodland managers would aim to have open space within 10-40% of grid cells. At Fox Hagg, open space is now found in 70% of grid cells to benefit the Williow Tit. This will make it less suitable for woodland inhabitants that prefer a closed canopy structure.

Map of Fox Hagg showing grid cells with dead wood present. The majority of the reserve has dead wood present, making it suitable to support a Willow Tit population (Figure credit: Patricia Malcolm).
Map of Fox Hagg showing grid cells with open space. The majority of the reserve is open woodland, making it suitable to support a Willow Tit population (Figure credit: Patricia Malcolm).

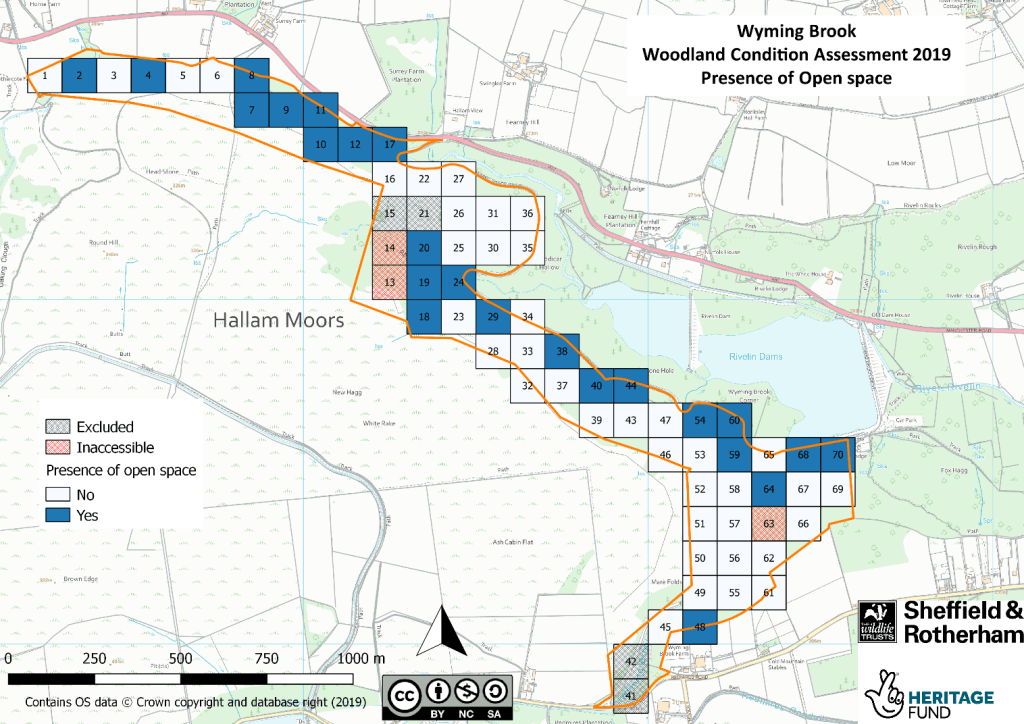
Wyming Brook, on the other hand, is an important habitat for the Wood Warbler: a species that prefers closed canopy mature woodland. Wyming Brook was found to only have open space in 40% of grid cells, showing it has been well-managed to support the Wood Warbler. Crucially, the data showed that grid cells without open space correlate with areas the Wood Warbler is known to occupy. This shows how the Trust can use the data to tailor management to each site specifically.

A map of Wyming Brook showing grid cells with open space present. The majority of the woodland is closed canopy, making it suitable to support a Wood Warbler population (Figure credit: Patricia Malcolm).

“The volunteers have done a fantastic job to collect and collate this monitoring data for Fox Hagg & Wyming Brook and it is very much appreciated. The data gives us a fantastic baseline to work with and it is great to see that we are meeting our targets for specific woodland condition attributes such as the presence of dead wood and temporary open space in the correct areas for our star species such as willow tit and wood warbler. The results will also help us identify areas where we can improve and target our management to help improve habitats for wildlife across these two fantastic nature reserves in the Rivelin Valley.”

Rob Miller, Reserve Manager

Volunteers spent over 500 hours rambling through Sheffield woodland to complete these surveys, so it’s great to see that the data we collected has already been used to improve management of woodland reserves. As always, I really enjoyed taking part in the woodland condition monitoring. It was a great opportunity to brush up on my tree species ID skills (crucial when you study ecology!), while exploring these beautiful woodlands. Get in touch with your local Wildlife Trust to find out how you can help protect wildlife in your area. Treat your mind and body to the benefits of being in woodland, whilst giving something back to the wildlife in your local area – what could be better?

Volunteering with ‘Data for Nature’ – an opportunity ‘newt’ to be missed

Hello again! This post is all about another of my volunteering adventures with the Sheffield and Rotherham Wildlife Trust. If you read my last blog post, you’ll know I’ve been working with the National Lottery Heritage funded ‘Data for Nature’ project, which aims to improve ecological data bases for nature reserves in and around Sheffield. If you didn’t suss it from the cheesy pun in the title, my latest excursions had me on the hunt for newts. Specifically, the elusive Great Crested Newt. Over a three-month period, a handful of volunteers completed six Great Crested Newt surveys in Sheffield’s Woodhouse Washlands nature reserve. Our aims were: a) to estimate the population size of Great Crested Newts in the area, and b) to work out how suitable this site was as a newt habitat. This will help the Wildlife Trust improve and maintain the reserve so the newt population can thrive both now and in the future. Like all the ‘Data for Nature’ initiatives, these surveys help improve databases held for wild populations in the Sheffield and Rotherham area and allow the Trust to improve management of its reserves to best suit wildlife living there.

Great Crested what?

So, what actually is a newt? Newts are salamanders, which are a group of amphibians characterised by their lizard-like appearance. They have slender bodies, rounded snouts, short limbs and a tail. Unlike other members of the salamander family, newts are semi-aquatic. This means they live in both terrestrial and aquatic habitats. The Great Crested Newt is a species of newt that only lives in Europe. Females can reach 7 inches in length, making them the largest species of newt on the continent. Thanks to its prehistoric demeanour, the Great Crested Newt is often described as a mini dinosaur. They are near black in colour with bright orange bellies and spotted flanks. The males especially, with their warty skin and crinkly crest, do look like small, slightly pathetic Stegosauruses. These warts are actually vital to the newts’ survival, as they secrete a milky rancid substance that dissuades predators. The species breeds in ponds in the spring before moving into woodlands, grasslands and hedgerows to feed on invertebrates later on in the year. We carried out our surveys in the late spring when the newts are in their aquatic breeding habitat. This made it easier to locate and count the newts. When you imagine trying to find newts in a woodland the old ‘needle in a haystack’ image comes to mind.

Getting up close and personal to a Great Crested Newt. Here, you can see the warty skin and spotted flanks that characterise a Great Crested Newt. Its crest is flaccid because it is out of the water. (Photo credit: Libby Pool).

Other newt species…

We recorded sightings of other newt species living in Woodhouse Washlands, such as the Smooth Newt and the Palmate Newt, though we didn’t come across many of the latter. We counted these other species of newt to see how well a variety of species are doing in the area. The Smooth Newt, also aptly known as the ‘Common’ Newt, is the species you will most likely see in your own garden or pond. They are grey-brown in colour with an orange belly and neat spots all over. Confusingly, male common newts also develop a crest during the breeding season. You can use this crest as a neat way of telling a Great Crested Newt and a Smooth Newt apart: the Smooth Newt’s crest runs unbroken for the entire length of its body and tail, while the Great Crested Newt has a break in its crest where the tail and body join.

This photo shows the difference between the underbellies of a Smooth Newt (left) and a Great Crested Newt (right). You can also see that the Great Crested Newt is black in colour, while the Smooth Newt is grey. (Photo credit: Libby Pool).

Our survey design

The Great Crested Newt is actually listed as a European Protected Species. This means that the newts, their eggs and their breeding sites are all protected by law and it is an offence to disturb them. This law dictates that a licensed ecologist must be present for any survey carried out on Great Crested Newts. To fulfil this requirement, we volunteers worked with license holders from Wildscapes CIC: an environmental consultancy and subsidiary of the Sheffield & Rotherham Wildlife Trust. Only 2-4 volunteers helped per survey to minimise disturbance to the newts on site.

To carry out an accurate newt survey, license holders are required to collect population data in three different ways. Our three methods were: bottle trapping, torching and egg searching. Bottle trapping involves counting the number of newts caught in bottle traps set up in the ponds. As the name suggests, these ‘bottle’ traps are not the most high-tech ecological equipment…they are literally 2 litre bottles with the nozzle cut off and inverted. Crucially, however, they allow newts to swim in to the bottles but prevent them from swimming out again. We set these traps up around the perimeters of all 6 ponds on site at dusk. As newts are nocturnal, we had to wait until morning to see how many we’d caught. Once the traps were set, we waited (often at the pub) until sunset to complete our second method of data collection: counting the number of newts in each pond by torchlight. Using a powerful torch beam, we skimmed the bottoms of the ponds for any signs of newt activity. We didn’t get home until around midnight after this torchlight search, only to be up at the crack of dawn the next day to release our trapped newts (who needs sleep, right?). The plastic bottle traps get hot very quickly if left in the sun too long, so we had to make sure we had counted and released any trapped newts before the morning sun cooked them. Much to our delight, we found handfuls of newts in our bottle traps on those early mornings. As my friend and fellow volunteer Beth said, “at least we didn’t get up at 5am for newt.”

An example of the handfuls of newts we released from our bottle traps at dusk on the second day of surveying (Photo credit: Libby Pool).
A male Great Crested Newt in a bottle trap with its namesake crest on show (Photo credit: Libby Pool).

Our final method of data collection was to record the presence or absence of newt eggs at each pond. Newts lay their eggs on leaves around the edges of ponds. Once deposited, they nimbly fold the leaf in half to protect the tiny egg inside. Check out this fascinating photo I took of a newt embryo developing in its egg we found on site!

A newt embryo developing on a leaf found on site (Photo credit: Libby Pool).

To assess how suitable each pond is as a Great Crested Newt habitat, volunteers completed a Habitat Suitability Index (HSI) during one of the surveys. This is a standardised method in which different aspects of pond suitability are analysed, including: pond area (m2), presence of fish and percentage macrophyte (vegetation) cover. This final aspect of the survey allowed the Trust to work out how suitable Woodhouse Washlands is as a newt habitat, so they could adapt their management of the site to maximise its ability to support a growing Great Crested Newt population in the future.

And finally…the results!

Overall, the volunteer team found some really positive results. We estimate that the population of Great Crested Newts in the Woodhouse Washlands reserve is 82 individuals – this is a really promising number! Six of the ponds on site scored ‘excellent’ in our HIS survey too. This shows us that a good number of ponds on site are already highly suitable habitats for the newts. This also highlights the ponds that scored lower in the HIS survey, so management can work to improve these areas. Interestingly, a correlation was found between the number of Great Crested Newts found in each pond and the HSI score. This means that ponds with higher HIS scores typically housed more newts. One pond on site was nicknamed ‘the party pond’ by volunteers; every time we emptied the bottle traps from this pond, we had caught a huge number of newts (see the photo above!) This pond turned out to be on of those that scored ‘excellent’ in the HSI survey, so it is no wonder all the newts wanted to be there to join in the party.

This graph shows the correlation between the mean number of newts found in each pond compared to the HSI score. (Figure credit: Isabel Commerford).

A volunteering oppurtunity ‘newt’ to be missed…

The newt surveys were by far the most enjoyable of the surveys I’ve been involved with for ‘Data for Nature’ so far. Despite the sleep deprivation, it was actually really good fun being out with a group of welly-booted people stood around ponds at midnight – we had a lot of laughs. It was really nice to be out in nature at dawn and dusk: the times we don’t normally get to appreciate it. Watching the sun set over the reserve was stunning, and one of the team had the good idea of bringing a bat detector so we could listen to the bats overhead in the trees. One evening, we even saw a fox patrolling the landscape. Its experiences like these that make volunteering with the Wildlife Trust so special, so get onto your local Trust’s website and find some opportunities near you.  

You can learn more about ‘Data for Nature’ and volunteering here: https://www.wildsheffield.com/wildlife/wildlife-conservation/data-for-nature/

Check out these web pages for more information on Great Crested Newts:

If you’re interested in learning more about the other species of newt we surveyed, you can find out more here:

Find out more about Woodhouse Washlands here: https://www.wildsheffield.com/reserves/woodhouse-washlands/

Volunteering with ‘Data for Nature’ – Hunting for Harvest Mice

Since autumn last year, volunteers have been scouting nature reserves around Sheffield and Rotherham for everything from newt eggs, to skylarks, to harvest mouse nests, and much more in between. I am one of these eager volunteers, working under the Wildlife Trust’s ‘Data for Nature’ initiative. Over my next series of blog posts, I want to share with you why getting involved with ‘Data for Nature’ was one of the best decisions I made during my time at university. Volunteering for your local Wildlife Trust is not only a vital way of helping protect wildlife in your local area, it’s also great fun to get involved with!

I initially signed up to volunteer with the Wildlife Trust because I wanted experience in ecological surveys. However, my volunteering has become more than something to write on my CV. I’ve met so many like-minded people and learnt so much more about nature. You essentially get to go walking in nature reserves, collecting valuable ecological data on the way. But, before I go off on a spiel about how great volunteering is, I should tell you what ‘Data for Nature’ actually is and why it’s a worthwhile cause to devote your time to.

What is ‘Data for Nature’ all about?

‘Data for Nature,’ funded by the National Lottery Heritage Fund, was born in response to the Sheffield State of Nature report, which stated that gaps in the city’s ecological records should be addressed. The Trust aims to improve its database of wildlife populations within Sheffield and Rotherham. To do this, the Trust has set up rigid methods of monitoring for each species and/or habitat type. These robust monitoring frameworks are taught to volunteers on training days, so they know how to carry out each specific survey type. Armed with the ‘know-how’ to complete surveys on our own, us volunteers go out en-mass to other reserves and repeat the process. All in all, this massively increases the Trust’s capacity to collect data. In the words of Julie Riley from the ‘Data for Nature’ team:

“we are developing set methodologies so that surveys can be repeated and analysed over the long term, helping the Trust to see how effective its management of each reserve is, and make changes if needed.”

The first survey….harvest mice populations

The first ‘Data for Nature’ survey began in November last year, when we searched the Carr House Meadows reserve for harvest mouse nests. In case you’ve never seen one, the harvest mouse is the smallest rodent native to Europe. Adult harvest mice can weigh as little as a 2p piece! You’ll find harvest mice from central Yorkshire southwards, scurrying in long grasses and reeds. The harvest mouse is the only British mammal to have a prehensile tail, which it uses as a fifth limb to hold on to the grass stems it feeds and breeds in. In the breeding season, harvest mice weave dome-shaped nests out of grass. These are found between half a metre and a metre above-ground in dense vegetation, out of sight of predators stalking the grounds below.

One of the volunteers with a harvest mouse nest found at Carr House Meadows! (Photo credit: Sharron Burton)
A harvest mouse nest next to a 20 pence piece for size comparison (Photo credit: Nick Howard)

In this survey, we systematically searched for nests as an indicator of harvest mouse presence. Searching for mice themselves would be too time consuming and, unlike mice, nests don’t move, so you have a much higher chance of finding them! The Carr House Meadows reserve is divided up into a series of fields. We searched the perimeter of each field, where the vegetation is taller and denser. We moved around the perimeter taking quadrats of a given area. Within each quadrat, we measured:

  • Whether or not 50% of the vegetation was over 0.5 metres tall.
  • How well connected the area was.
  • The dominant plant species in the area.
  • The presence of any harvest mouse nests.

Why did we measure these things?

These aspects of the reserve were measured to assess how suitable it is as a breeding habitat for harvest mice. For example, the minimum height a harvest mouse likes to build its nest above ground is around 0.5 metres, so assessing whether of not more than 50% of the vegetation is at least this height allows us to see whether there is substantial tall grass available for the mice to nest in. A suitable breeding habitat would also be well connected to foraging grounds by dense grasses or shrub margins. This allows mice to move between their nest and foraging sites through dense grasses, which best obscures them from predators. We also identified the dominant plant species in the area to see which vegetation best supported nesting. In our training session, we were shown how to identify common grasses and shrubs in the reserve. We were also taught how to identify harvest mouse nests as some bird species, like reed warblers, construct similar looking spherical nests. This training was very useful when we did come across nests which turned out to belong to birds rather than harvest mice. When we found a suspected harvest mouse nest, photos were taken and sent to a mammal expert at the Trust who confirmed the nest’s identity.

Surveying the dense vegetation in the perimeters of the fields at Carr House Meadows (Photo credit: Pete Tomlin)

The results…

We were excited to find two nests at Carr House Meadows. Though two doesn’t sound that impressive, this gives us great hope that the reserve does serve as a suitable breeding habitat for harvest mice. These maps, produced by Hannah Davis, show the locations of these two nests. The first map shows the results for our vegetation cover analysis. This indicates that 50% of the vegetation cover in the quadrats neighbouring the nests was not greater than 0.5 metres. This is surprising, considering the typical nesting habits of harvest mice. The second map shows the results for the overall connectivity of the quadrats neighbouring the nests. Both nests seem relatively well connected, particularly the nest in location one. This initial analysis suggests that connectivity may be more important to a harvest mouse choosing a nesting site than vegetation cover. Pete Tomlin from the ‘Data for Nature’ team suggested we may only have found two nests in the reserve because there is not enough rough grass cover around the field edges to allow easy movement. This makes sense, as harvest mice need nesting sites to be well connected to their feeding grounds by dense grasses, allowing predator evasion during foraging. Increasing the rough grass cover around the reserve perimeter may be crucial in encouraging population growth. The final map shows the results for the dominant plant species around the nest. Our two nests seem to have a lot of bramble in neighbouring quadrats, suggesting this is a good plant species for the nests to be hidden within.

The results for vegetation cover analysis as part of the harvest mouse survey at Carr House Meadows
The results for the connectivity analysis as part of the harvest mouse survey at Carr House Meadows
The results for the dominant plant species analysis as part of the harvest mouse survey at Carr House Meadows

Since the survey at Carr House Meadows, ‘Data for Nature,’ volunteers have tried out the protocol at another reserve: Woodhouse Washlands. A full survey is due to take place this autumn. It will be interesting to see if results seen at this second site are similar to the results above. Importantly, these results will give the Trust the opportunity to make changes to the way these reserves are managed. This should involve increasing connectivity, so more harvest mice use the site to breed in the future.

Scavenging the hedgerows for harvest mouse nests in this first survey for ‘Data for Nature’ made me eager to get out and do more. If, like me, you enjoy digging around in hedgerows, ponds and woodlands, sign up to volunteer with your local Wildlife Trust.

You can learn more about ‘Data for Nature’ and volunteering here: https://www.wildsheffield.com/wildlife/wildlife-conservation/data-for-nature/

Check out this page for more information on harvest mouse ecology: https://www.wildlifetrusts.org/wildlife-explorer/mammals/harvest-mouse

Find out more about Carr House Meadows here: https://www.wildsheffield.com/reserves/carr-house-meadows/

Does sunbathing in February feel right to you?

This is a piece I wrote for the latest edition of the University of Sheffield’s pH7 science blog. Extreme weather is an issue we need to start talking about in the wake of our changing climate. Just this weekend in Sheffield, we’ve experienced gale-force winds, rain, sleet and some occasional sun. The weather seems to be more and more unpredictable each year and last month saw unseasonably high temperatures. Here are my thoughts on the record breaking temperatures of February 2019.

The last week of February saw temperatures soar across the UK. Everywhere, people took to the parks, ice creams in hand, to bask under bright blue skies and glorious sunshine. No one can deny that weather this beautiful is unheard of in February. Temperatures this high are so unusual that they were actually record breaking. The UK’s record for February was set in 1998, when temperatures in Greenwich reached 19.7 °C. Incredibly, a high of 20.6 °C was recorded in Trawsgoed, Wales on 25th February 2019. This is the first-time temperatures have topped 20 °C in winter.

I spent my February heat wave weekend under blue skies at the Clavering Lakes near my home in Essex.

After the chilly winter months, I enjoyed the warmth on my skin as much as the next person. However, the warm weather gave me a sense of uneasiness I found impossible to ignore. This time last year, ‘the Beast from the East’ was raging across the UK. Temperatures were sub-zero, and snow covered the landscape. I know I wasn’t the only one concerned by this drastic change in weather events, as people took to the internet to compares photos of the same locations taken in February 2018 and 2019. I found these images particularly stark: https://www.eveningexpress.co.uk/news/uk/what-a-difference-a-year-makes-pictures-highlight-change-in-february-weather/amp/

Clearly, we are experiencing more extreme weather events year on year…but why? Are these one off, freak events or evidence of long-term climate change?

High pressure air and the Foehn effect:

The Met Office attributed the warm weather of February 2019 to two things: the first being unusually high pressure across continental Europe. This brought warm air from the Canary Islands and North Africa across the continent, warming the UK in the process. Secondly, they claim the Foehn effect brought temperatures away from the norm. This is where high humidity winds flow over mountains, condense, and forms clouds. Heavy rain occurs on one side of the mountain, but the air gets warmer and drier as it sinks on the other side. The UK sits under this warm, sinking air, creating the sunny conditions seen in the last week of February.

While these climatic processes explain the unusual heat of February 2019, we need to think about why climatic interactions themselves are changing. We wouldn’t normally see such high pressure air moving across Europe at this time of year, so why did it happen in 2019? Meteorologists are now considering the extent to which these unusual weather events can be attributed to man-made climate change.

What do the experts say?

Geert Jan van Oldenborgh, a climate researcher at the Royal Netherlands Meteorological Institute, conducted a study on UK temperature data and found February’s high temperatures to be “at least a one in 200-year event.” This event was so exceptional that climate scientists are having to rethink their models. Temperatures deviated so far from the norm that models could not account for such extreme change. Professor James Screen, a climate scientist from the University of Exeter, claims “it’s very hard to say that a couple of days of good weather is because of climate change.” However, he does confirm that we are seeing an increase in extreme heat events due to increasing mean global temperatures. We have already seen evidence of this in recent decades. For example, around 500 years of temperature data show that the five coldest years range from 1695 to 1902. The five hottest years have all occurred since 2005. While experts are not yet sure the events of February 2019 can be fully accounted for by climate change, there is little doubt it played a part.

But, why should we care?

The sun is shining, you’re outside enjoying a cold one with friends – the last thing you want to think about is the impending threat of climate change. However, in 2003, a heatwave across Europe caused 70,000 deaths. Climate studies showed this extreme heat was attributable to man-made warming. Carbon emissions are severely impacting human well being. We have already caused a 1 °C increase in global temperatures and, according to a major UN report, we have ‘locked in’ an additional 0.5 °C. If we reach 2 °C warming, it is predicted that 411 million people will suffer from water shortages.

As an ecology student, I’m concerned with how extreme events impact wildlife. The heat of February 2019 has seen species such as hedgehogs, bats and dormice coming out of hibernation too early. This puts them at risk of death as they are using up fat stores they need to reserve at this time of year. They are also waking up before their primary plant food sources have bloomed, meaning they suffer food shortages, a process known as ‘trophic mismatch.’

Final thoughts…

We really need to ‘sober up’ to the realities of our impact on the climate – a thought shared by Green Party MP, Caroline Lucas. Lucas feels time is running out. The government is going backwards on climate action. This is not surprising when you hear that the first climate debate in parliament for two years was barely attended by MPs. In the wake of impending issues such as Brexit, climate action seems to be low on the government’s priority list. However, Lucas claims she finds, “huge hope from the rising tide of activism” after students took to the streets to demand climate action last month. Public acknowledgement of climate change will put pressure on the government to change legislation. So, in Lucas’ words: “if sunbathing in February doesn’t feel right to you, get out on the streets instead.”

Check out these links for more information on the heat wave of February 2019:

An Introduction…

A little bit excited about ecology?

I’m Libby, an Ecology and Conservation student at the University of Sheffield. I’m starting ‘Bees, Trees & Curiosities’ as a means of sharing my thoughts and findings on anything to do with nature and the environment. There are so many wonderful, curious things in the natural world. This will be my way of celebrating them. I’ll write about the ecology of species I particularly like, explore wider environmental issues and maybe even go a bit ‘travel blog-esque’ in talking about my walks and travels. I have a great fondness for bees and happen to be starting a beekeeping training course tonight – so posts about bees can only be expected! I hope this sounds like something someone, somewhere, might like to read.

We all need to be a little more considerate of the natural world in this day and age. I hope my ramblings show you that nature deserves to be talked about. If you have any suggestions of things you would like me to research and write about, please do get in contact. For now, here’s a photo of my doing what I do best…surveying!